
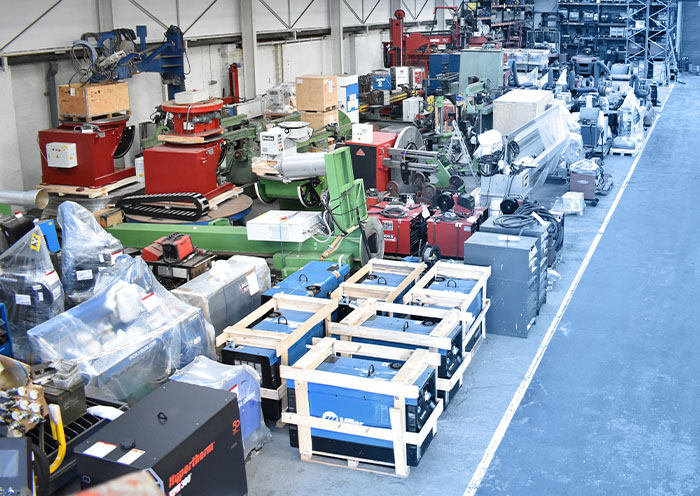
 600+ machines in stock
 Worldwide delivery
 Rated Excellent
 Warranty included
 Qualified engineers
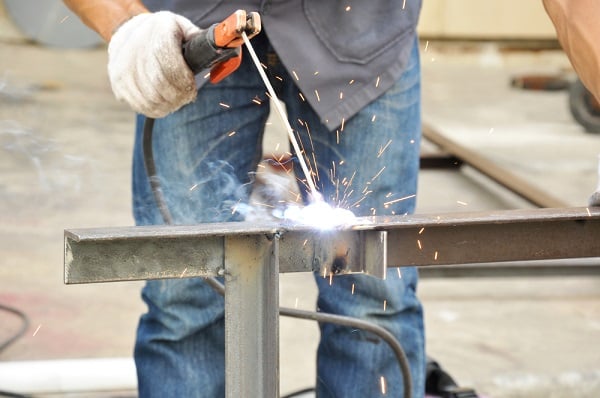
Westermans are proud to announce their latest infographic that looks at fatal and non-fatal injuries in the workplace.
Based on data from the Health and Safety Executive Annual Statistics Report, this infographic looks at the key data points and the cost to society. Scroll past the infographic for more data and to read about welding industry specific examples and links to further data, stories and research.
Fatal and Non-Fatal Injuries in the Workplace – An infographic by the team at Westermans International
Welding Risks
During the 2012/13 period, 148 workers were killed at work and thousands more injured. Unsurprisingly, the industrial sectors suffer with the most injuries and construction had the highest rate of all. Welding is one area of construction in which workers face the possibility of extreme and even fatal accidents every day.
Common Injuries
The Queensland government have put together a guide illustrating the most common injuries acquired in the welding industry. Eye injuries are the most frequent, with nearly a third of incidents affecting this area due to fragments of dust or metal entering the eye. Hands fingers and thumbs are also injured on a regular basis, with 21% of injuries caused by wounds or lacerations to this area. Lifting, moving, twisting and kneeling are also huge causes of injury. A small number of accidents are caused by workers dropping metal or machinery – leading to bruising and even crushing of the foot and toes.
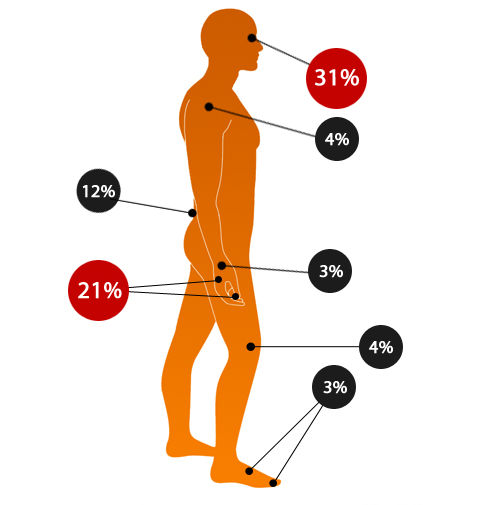
The most common welding injuries
Extreme & Fatal Injuries
It’s not just minor incidents that pose a threat to welders. Justice New Flash listed burns, explosion injuries, lung injuries and electrocution as common yet extremely destructive. Jonathan C. Reiter, a New York construction attorney, told Justice News Flash that in the USA owners and general contractors are responsible for worker safety on sites. They also have a duty to provide workers with necessary protective equipment and must inspect and test welding equipment before use.
There are safety measures and precautions that can be taken out to help avoid such situations. HSE.gov is a fantastic resource of information to help prevent welding accidents and incidents.
Explosions in Welding
Explosions have cost many welders their careers and even lives over the years. These incidents are often caused by faulty welding equipment, ignition of leaking fluid/ gas and poor welding practice. In recent years there have been a number of explosions on both small and large scale jobs.
In November 2012, three men at work on the Black Elk Energy Platform lost their lives when subcontractors used piping that had not been made safe for welding. This resulted in ‘unexpected conditions’ and eventually an explosion. More information can be found about this incident on Nola.com.
Back in 2013, a smaller scale incident took place in which a resident of Westhampton was injured in a welding explosion in his garage. WGGB reported that he was flown to hospital in a helicopter. The man, in his 20’s, was then treated for burns, cuts and a fracture.
Explosions are not always the direct reason for a fatality. They can actually cause other problems, such as equipment and structures falling and crushing welders. An incident that took place inside the Red Line tunnel, Washington DC, led to the death of 1 worker and injury of 2 others. MyFoxDC reported that crews heard a sudden loud noise, followed by fire. The explosion caused a 40 foot section of rail to collapse, striking the three workers.
Electrocution in Welding
HSE.gov explain that due to requiring a live electrical circuit, arc welders who use handheld equipment are at a higher risk of electrical shocks and burns. Environmental factors can also cause electrocution, as suffered by a construction worker in Phuket. The Phuket Gazette reported that the worker was shocked because the back of his welding rod touched a tree which was in contact with a high voltage line. You can read more about this incident here (please be aware that the link contains graphic images).
Illness & Injury in the Workplace
Illness in the Workplace
There are currently around 13,000 deaths every year because of work-related diseases. It’s thought that over half of these deaths are due to exposure and conditions faced many years ago. Asbestos exposure is the biggest killer, causing high rates of mesothelioma, lung cancer and asbestosis. Other substances such as silica and mineral oils contribute to the rate of fatal lung cancer developed through a person’s work. Dusts, gases and vapours are also accountable and have led to many cases of COPD or Chronic Obstructive Pulmonary Disease.
There are many other conditions which can be brought on by a person’s work and working environment. Whilst the above are long latency conditions, there are also more common health conditions to consider. These illnesses can be caused or made worse by work and include things like musculoskeletal disorders, skin diseases and asthma.
Injury in the Workplace
The majority of both fatal and non-fatal workplace injuries come from the industrial sectors. The most common injuries faced were slips & trips, falls from height and problems caused by manual handling.
Obstructions and uneven flooring are a huge cause of slips & trips and can be avoided if employers and employees follow simple safety regulations. Falling from a height has the biggest fatality rate of all workplace injury. The best ways to prevent falls are to train workers thoroughly, avoid working at height anywhere possible and use the appropriate safety equipment.
Manual handling is responsible for causing over a third of workplace injuries. It includes lifting, carrying, pulling and pushing. These movements, if performed incorrectly or repeated frequently, can result in both short term pain and even long term conditions such as musculoskeletal disorders. The best way to avoid injury as a result of manual handling is to use lifting equipment where possible and undertake thorough training. More statistics and advice on illness and injury resulting from work can be found on HSE.gov.
The Data
Injuries
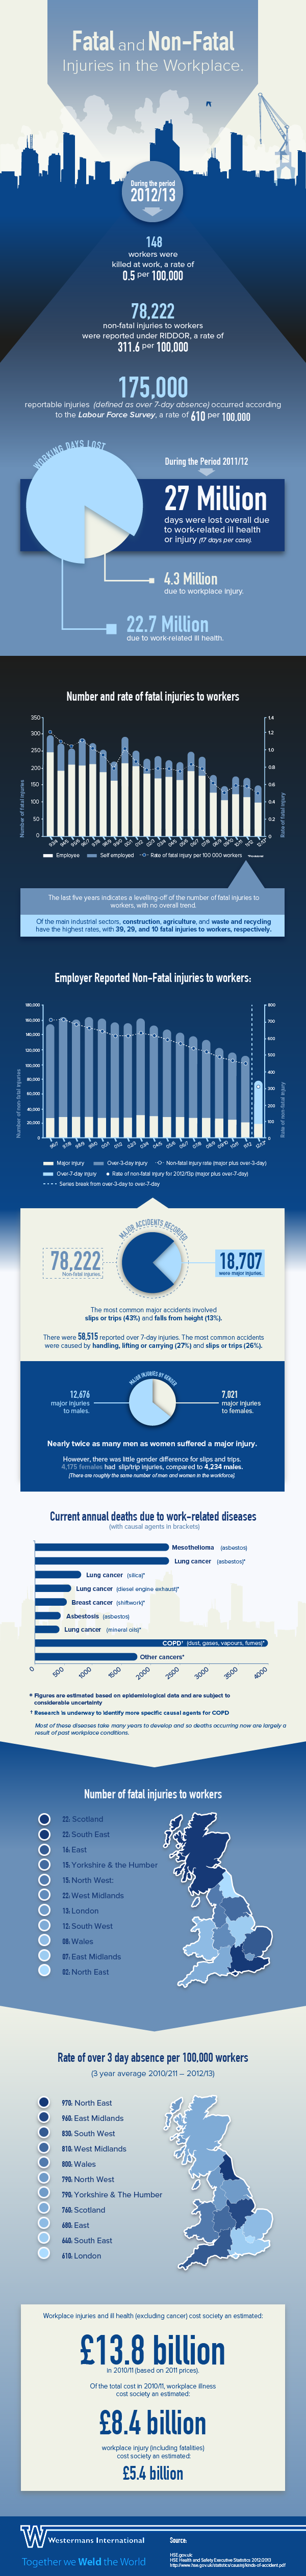
During 2012/13 148 workers were killed at work, a rate of 0.5 fatalities per 100,000 workers.
In the same period, 78,222 non-fatal injuries to employees were reported under RIDDOR, a rate of 311.6 per 100,000 employees. In addition to this, 175,000 reportable injuries (defined as over 7-day absence) occurred according to the Labour Force Survey, a rate of 610 per 100,000 workers.
Working days lost
In 2011/12 27 million days were lost overall due to work-related ill health or injury (17 days per case).
22.7 million due to work-related ill health and 4.3 million due to workplace injury. A more recent estimate for injuries indicates that 5.2 million days were lost in 2012/13 (no data is available for ill health).
Number and Rate of Fatal Injuries to Workers
The last five years indicates a levelling-off of the number of fatal injuries to workers, with no overall trend.
Of the main industrial sectors, construction, agriculture, and waste and recycling have the highest rates. These sectors accounted for 39, 29, and 10 fatal injuries to workers, respectively.
Employer Reported Non-Fatal Injuries
Of the 78,222 reported non-fatal injuries, 19707 were major injuries. The most common major accidents involved slips or trips (43%) and falls from height (13%).
There were 58,515 reported over 7-day injuries. The most common accidents were caused by handling, lifting or carrying (27%) and slips or trips (26%).
Nearly twice as many men as women suffered a major injury (12,676 major injuries to males and 7,021 to females). However, there was little gender difference for slips and trips. 4,175 females had slip/trip injuries, compared to 4,234 males. [There are roughly the same number of men and women in the workforce.]
Fatal Diseases
There are currently around 13,000 deaths each year from work-related diseases.
Most of these diseases take many years to develop and so deaths occurring now are largely a result of past workplace conditions.
Number of fatal injuries to workers
Scotland: 22
South East: 22
East: 16
Yorkshire and the Humber: 15
North West: 15
West Midlands: 14
London: 13
South West: 12
Wales: 8
East Midlands: 7
North East: 2
Rate of over 3 day absence per 100,000 workers (3 year average 2010/211 – 2012/13)
North East: 970
East Midlands: 960
South West: 830
West Midlands: 810
Wales: 800
North West: 790
Yorkshire and the Humber: 790
Scotland: 760
East: 680
South East: 640
London: 610
Economic costs to Britain
Workplace injuries and ill health (excluding cancer) cost society an estimated £13.8 billion in 2010/11 (based on 2011 prices).
Of the total cost in 2010/11, workplace illness cost society an estimated £8.4 billion; workplace injury (including fatalities) an estimated £5.4 billion.


comments
Pingback: Westermans Infographic: Fatal and Non-Fatal Injuries in the Workplace | Work Accident Report